2012: Geography of the App Economy Research Report
RESEARCH MAPS THE APP ECONOMY, INNOVATION JOBS ON THE RISE AND NOT LIMITED TO SILICON VALLEY
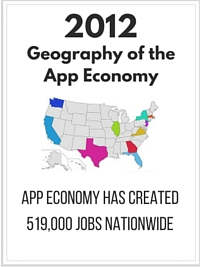
The app economy has created 519,000 jobs nationwide and is a significant economic driver for a number of states, according to a study released by CTIA-The Wireless Association® and the Application Developers Alliance. The report, entitled “The Geography of the App Economy,” also calculates the number of app economy jobs in each state, the “app intensity” (share of app economy jobs relative to overall jobs) and the economic impact for states. The research was conducted by Dr. Michael Mandel and Judith Scherer of South Mountain Economics, LLC.
While app innovation is occurring across the country, particularly in renowned high-tech areas such as California and Washington, some unexpected states have emerged to the top app economy states. For example, Virginia and Maryland have close ties to government agencies and the military thus are developing apps for those sectors. Massachusetts’ app developers are making higher education more accessible, while one Colorado app developer created the iTriage app, which helps people identify what could be wrong based on their medical symptoms.
The app economy is in its infancy, but is growing at an exponential rate. Apple iTunes and Android Market application stores first opened in 2008. According to CTIA’s research, there are more than 2.4 million apps available on more than 11 different operating systems from more than 28 independent non-carrier stores. In 2011, the mobile app revenue was almost $10 billion, but by 2016, it’s expected to be more than $46 billion.
The top 10 app economy states, ranked by economic impact (per million each year), are:
1. California = $8,241
2. Washington = $2,671
3. New York = $2,313
4. Texas = $1,183
5. Massachusetts = $1,143
6. New Jersey = $1,087
7. Georgia = $1,062
8. Illinois = $847
9. Virginia = $788
10. Pennsylvania = $632
The “app intensity” is determined by taking the percentage of app economy jobs in a state as a share of total jobs, which measures the importance of these jobs to a state. The national average is 1. The top 10 “app intensity” states and intensity figures are:
1. Washington = 4.47
2. California = 2.71
3. Massachusetts = 1.71
4. Oregon = 1.70
5. Georgia = 1.56
6. New Jersey = 1.29
7. New York = 1.16
8. Virginia = 1.04
9. Delaware = 0.93
10. Colorado = 0.90
Building on the February 2012 study by South Mountain Economics that measured the total number of app jobs nationwide, this study delves deeper into theApp Economy. Researchers examined The Conference Board Help Wanted OnLine (HWOL) database of help wanted ads in each state to calculate the number of app jobs as well as the economic impact of each state’s app economy.

Download Report

The Developers Alliance is a non-profit global membership organization that supports developers as creators, innovators, and entrepreneurs. The Alliance promotes the continued growth of the industry and advocates on behalf of their members on public policy and industry issues. Membership includes a global network of more than 70,000 developers with diverse skills, expertise, and interests; and hundreds of companies that depend on and work with developers.


